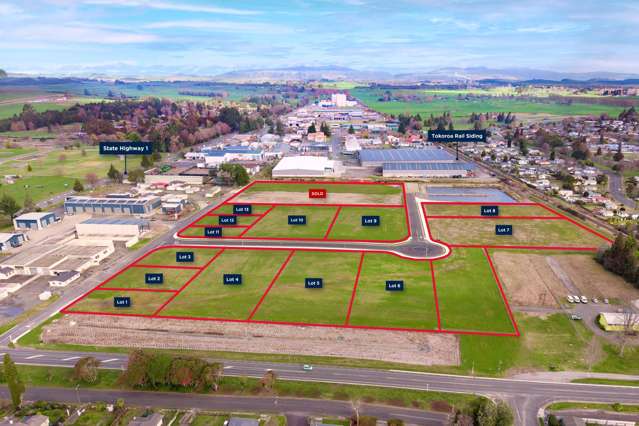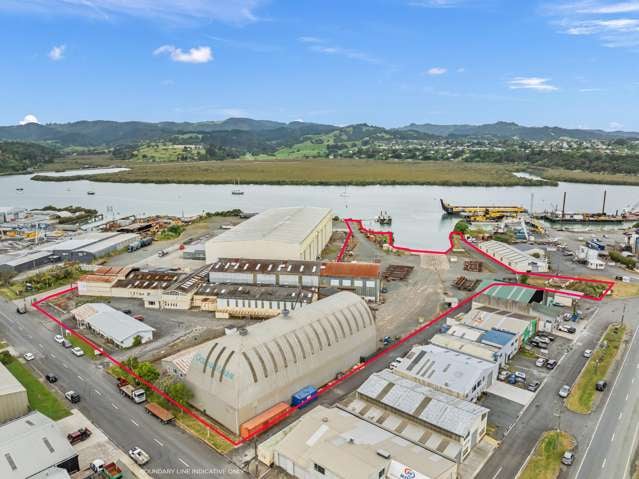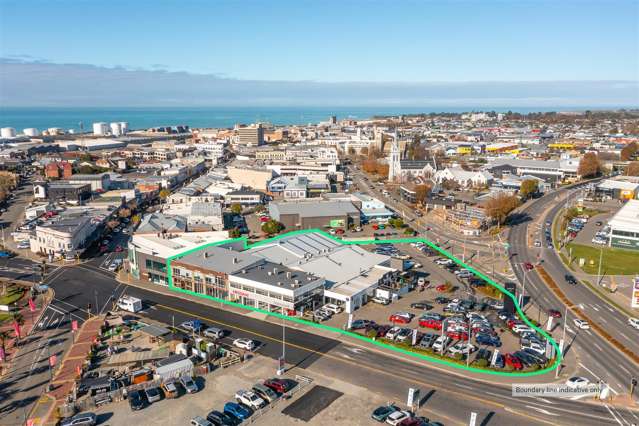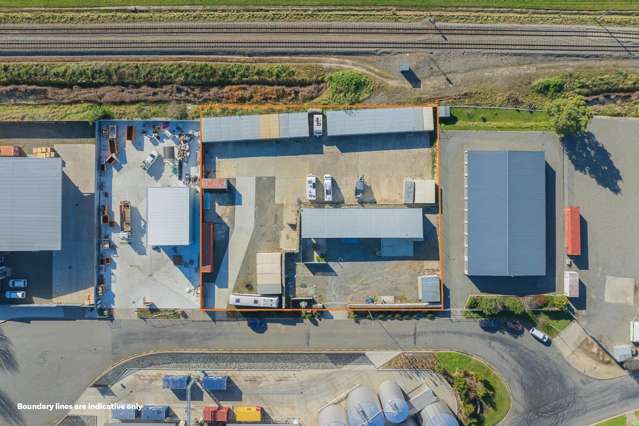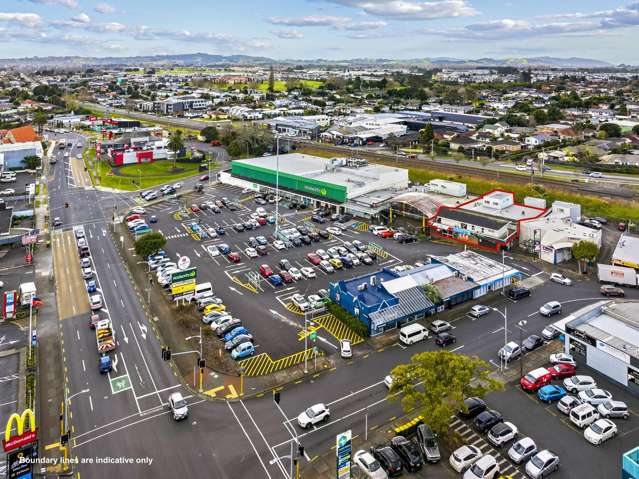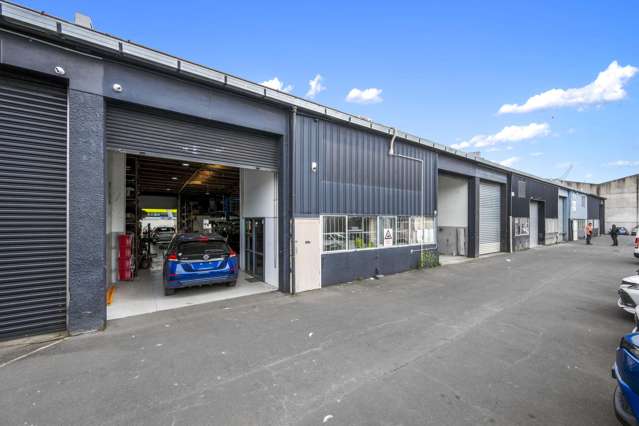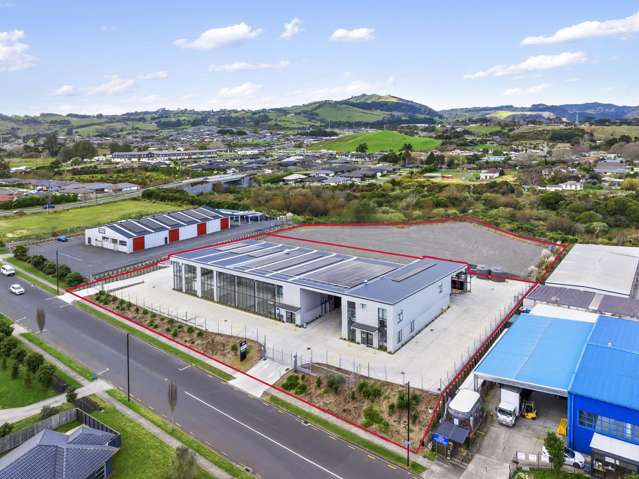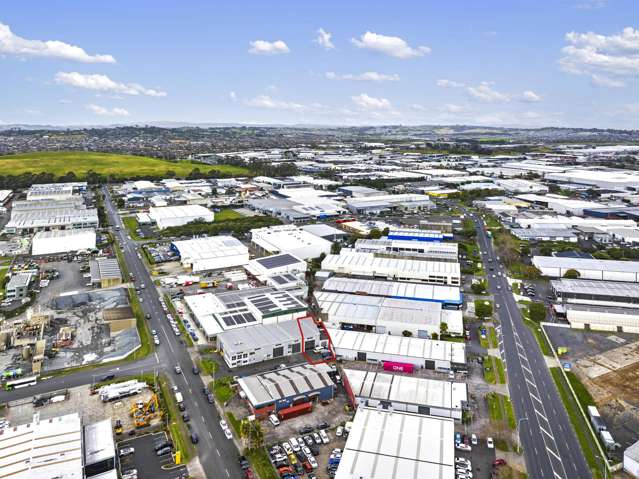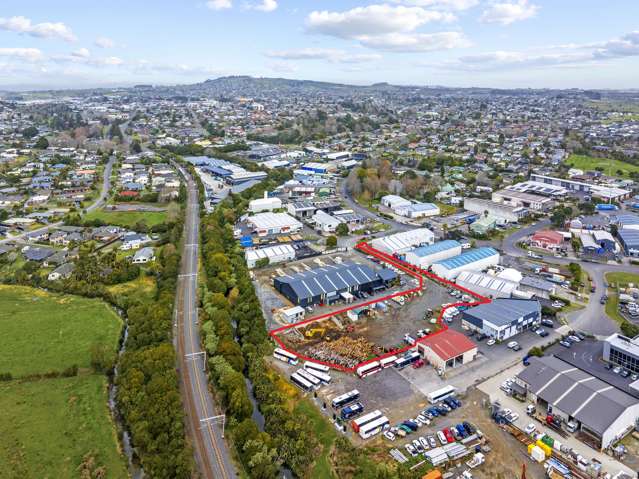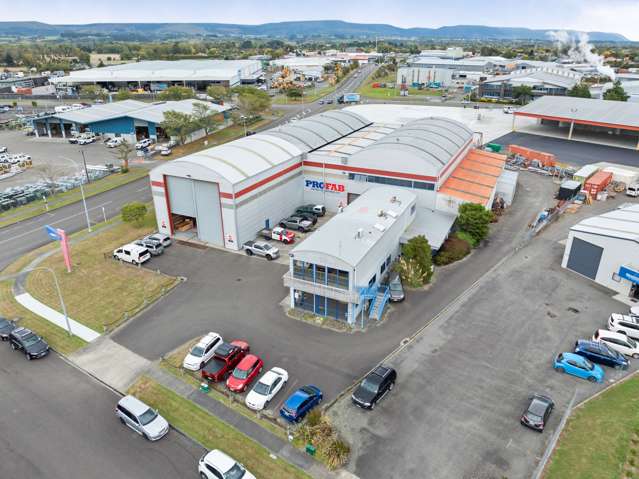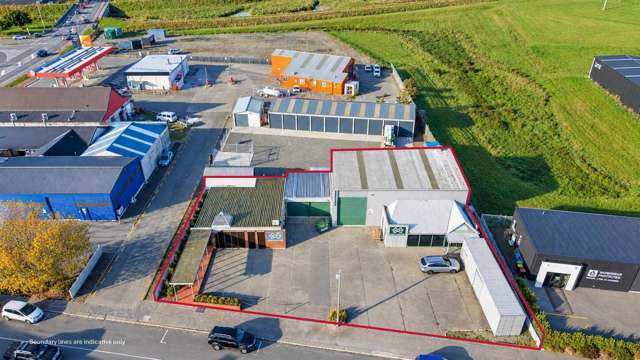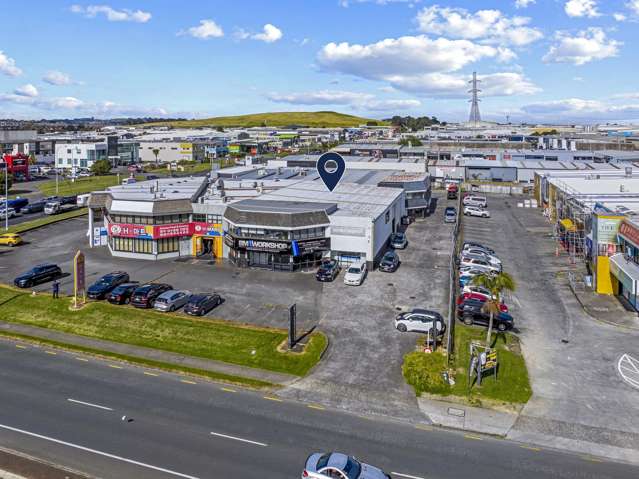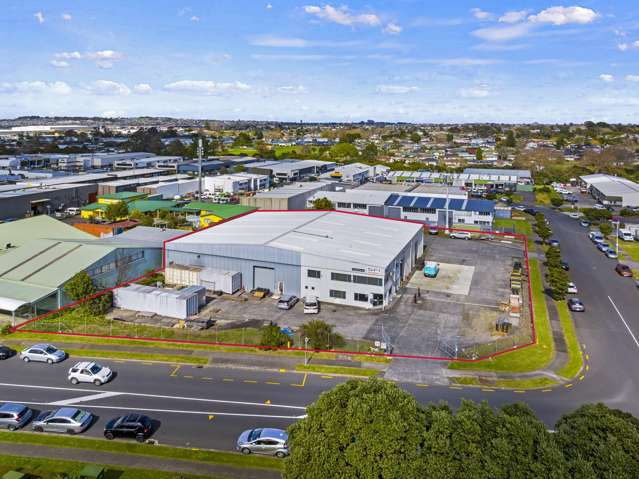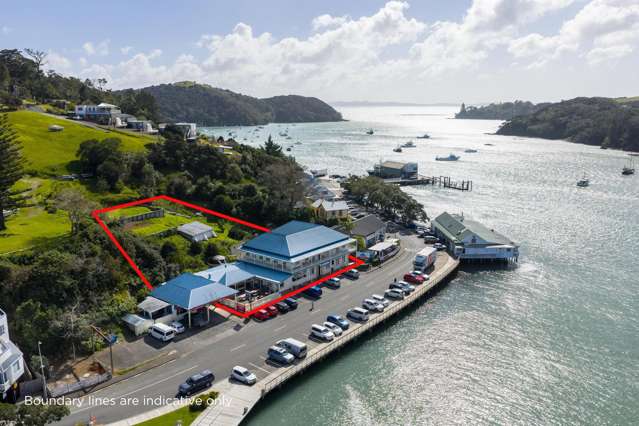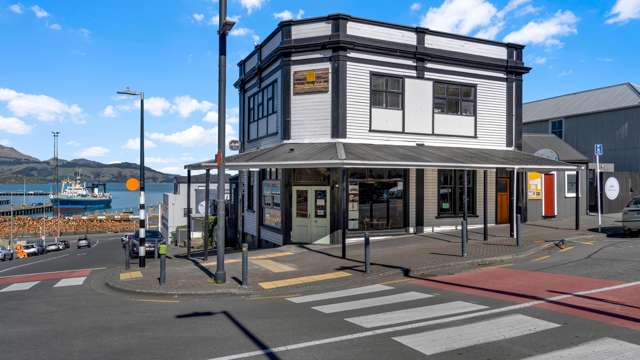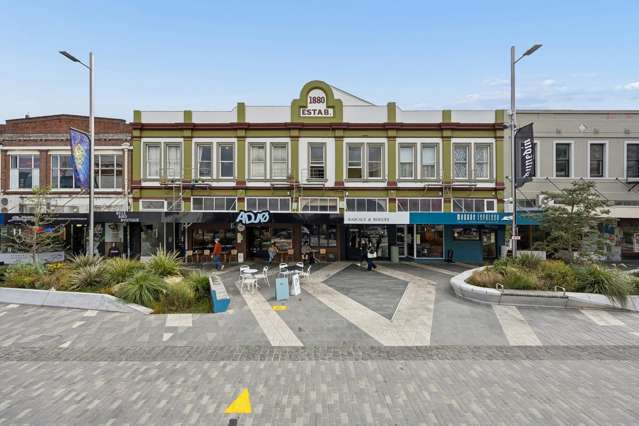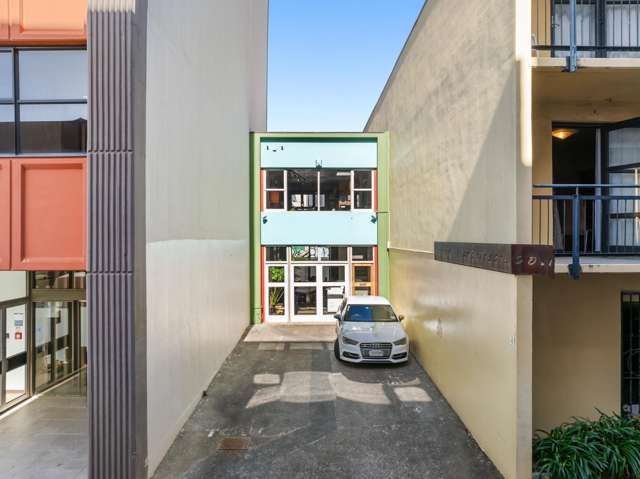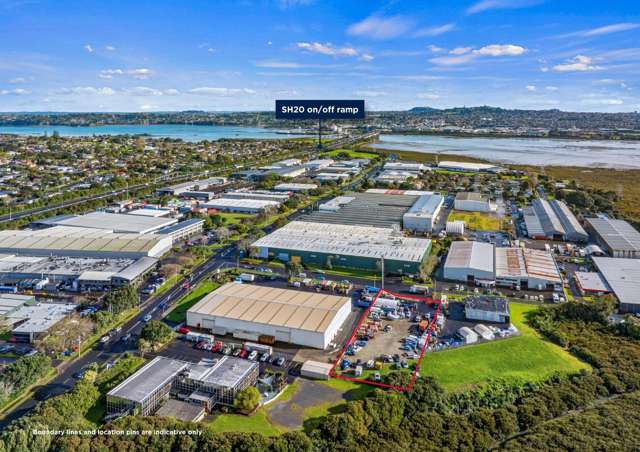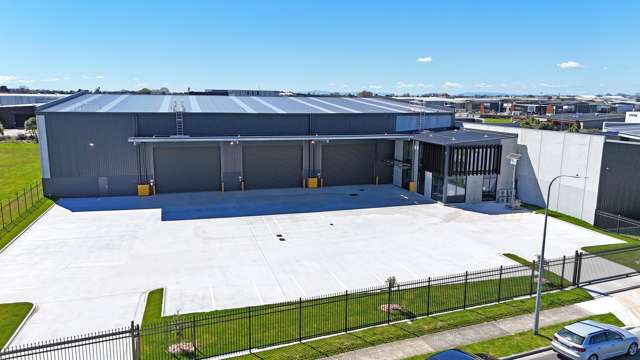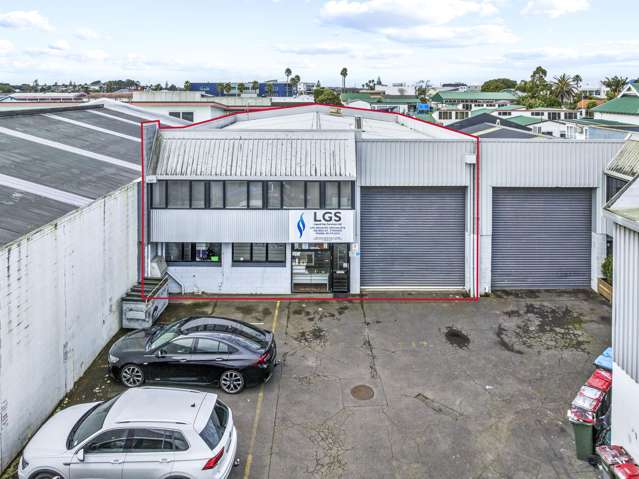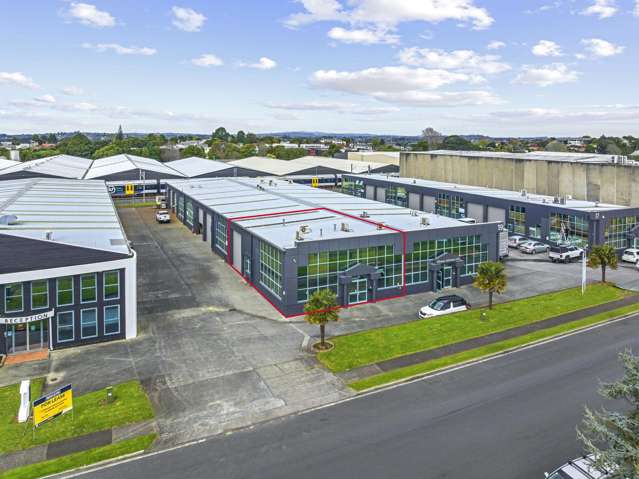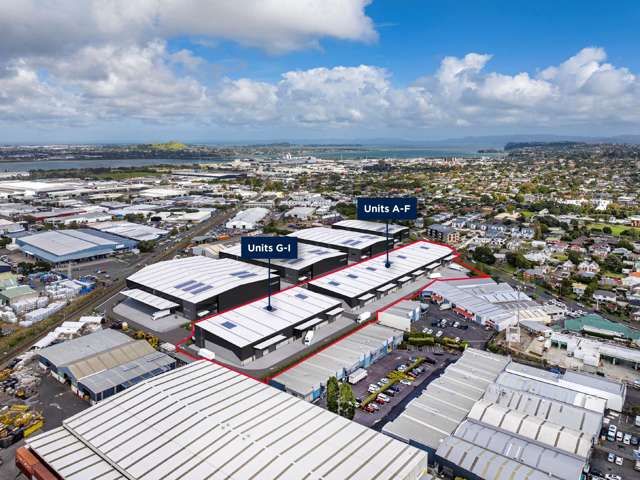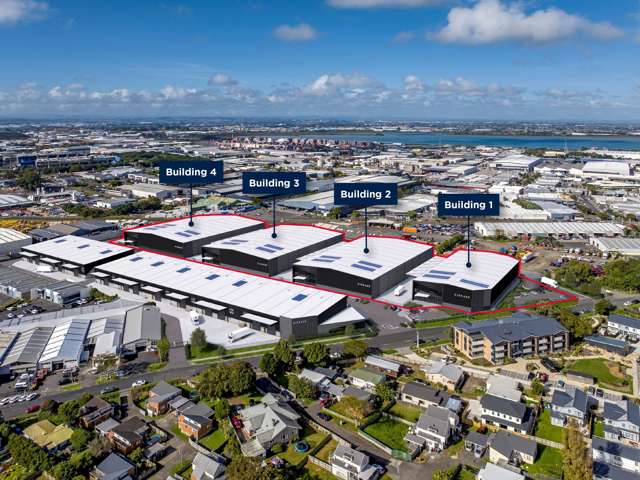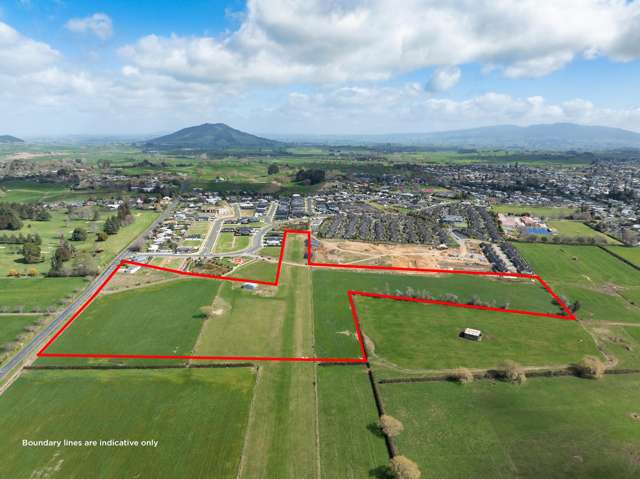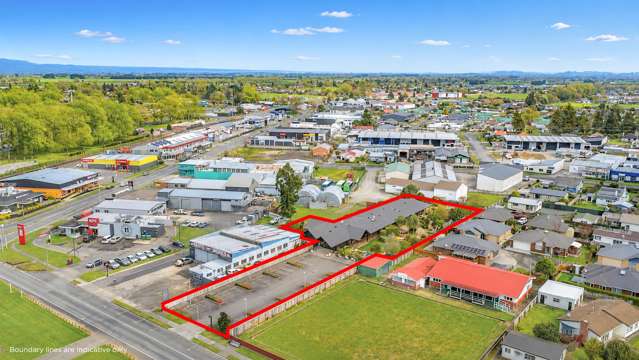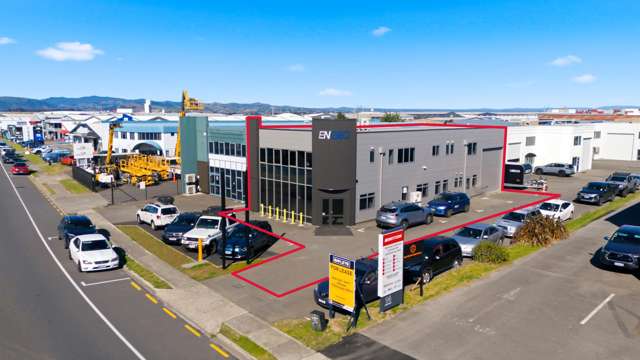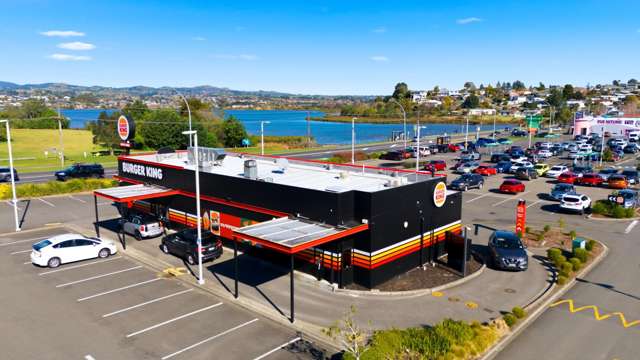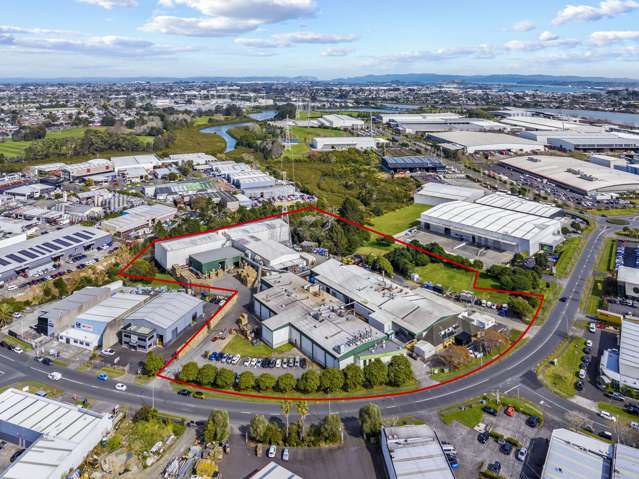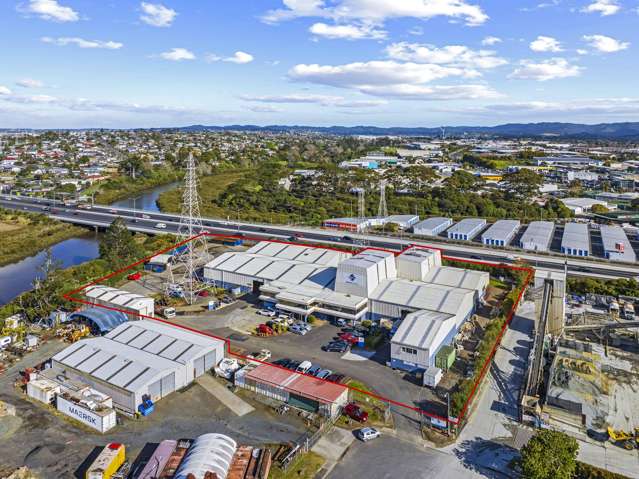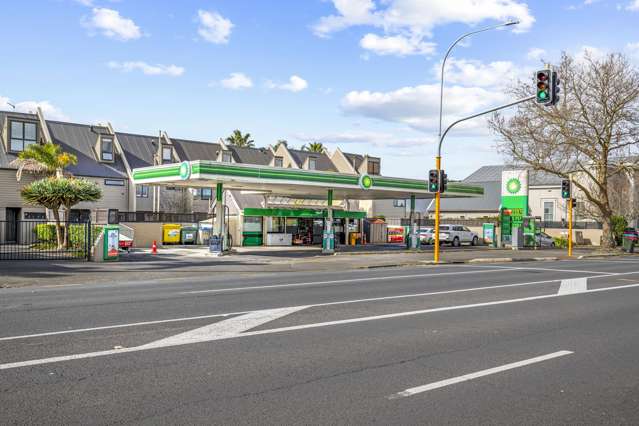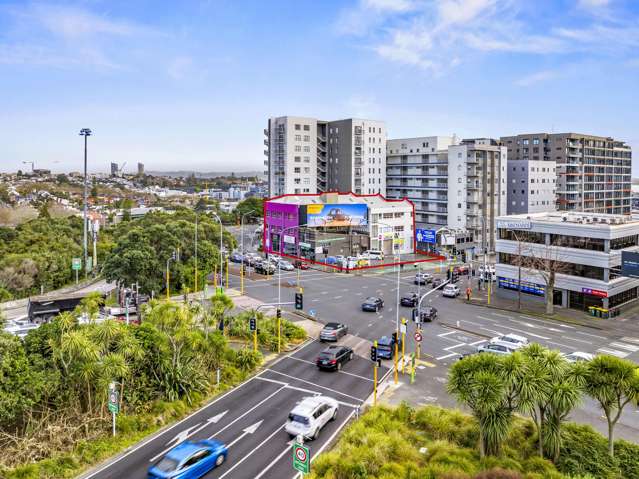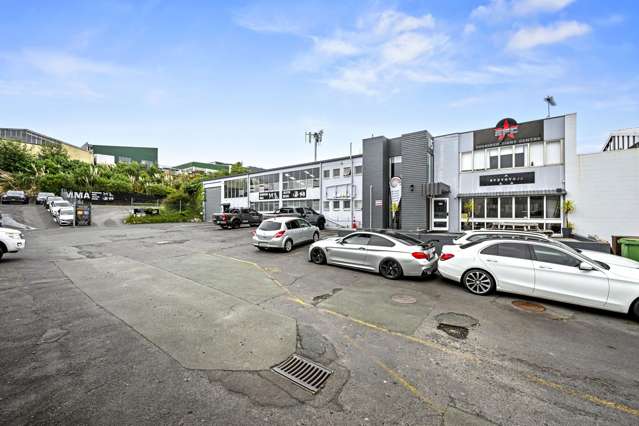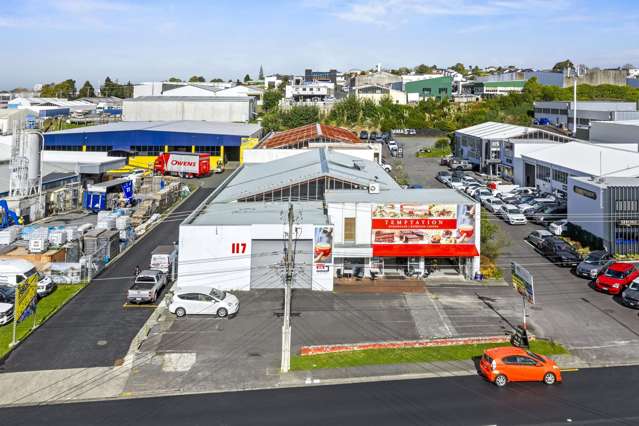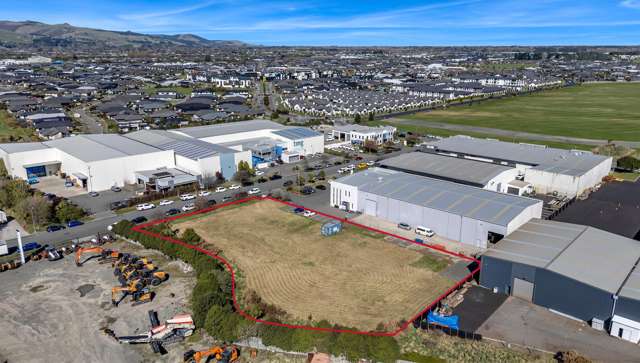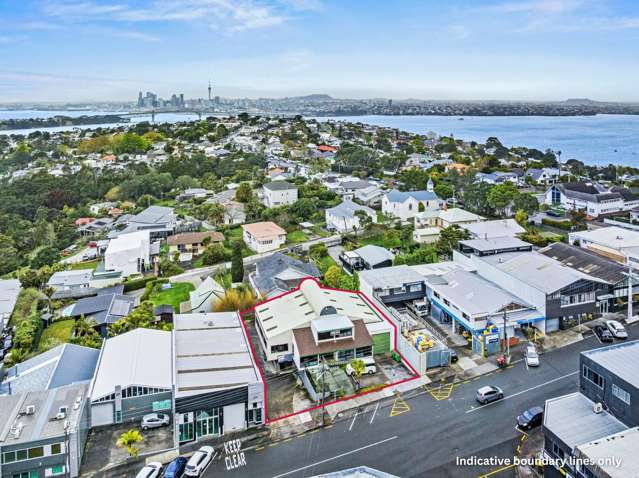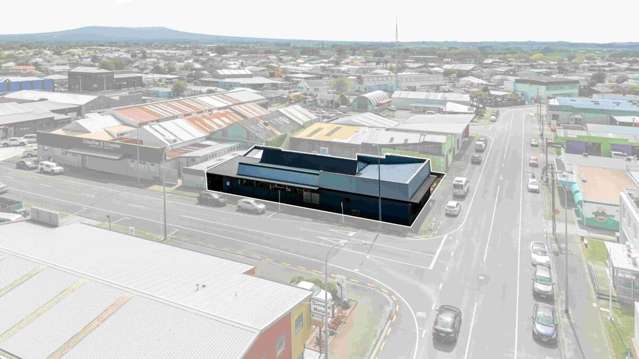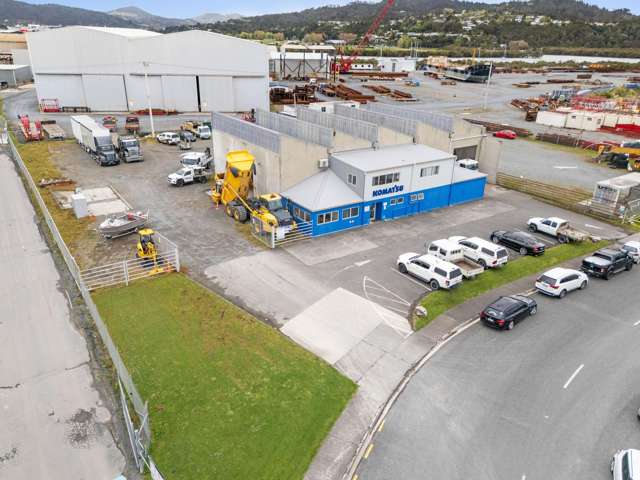
Industrial assets continue to anchor New Zealand’s commercial property market, according to the latest monthly report from the Colliers Research & Economics team.
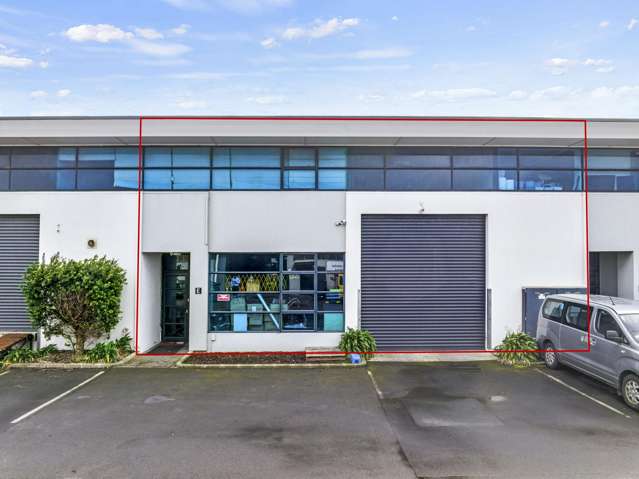
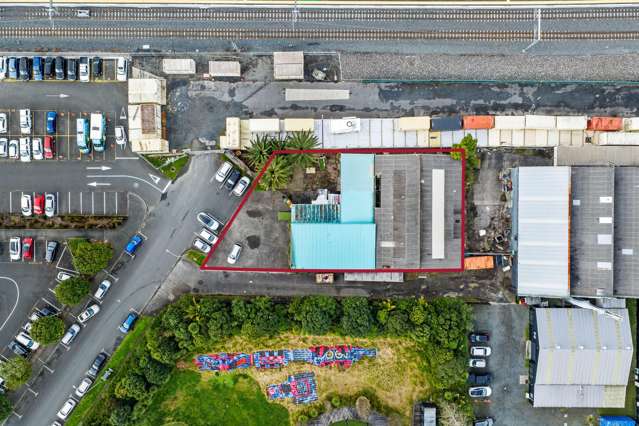
The composition of the market across the past 20 years has gradually shifted and the share held by the industrial sector has steadily increased.
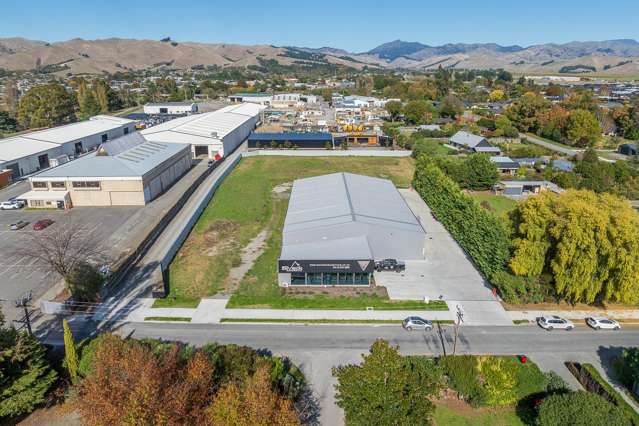
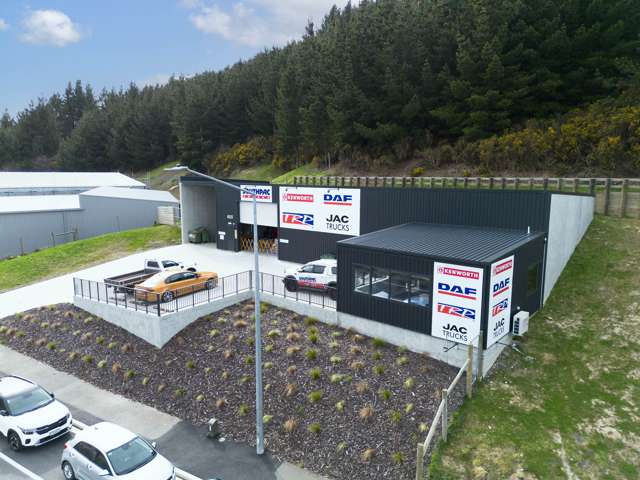
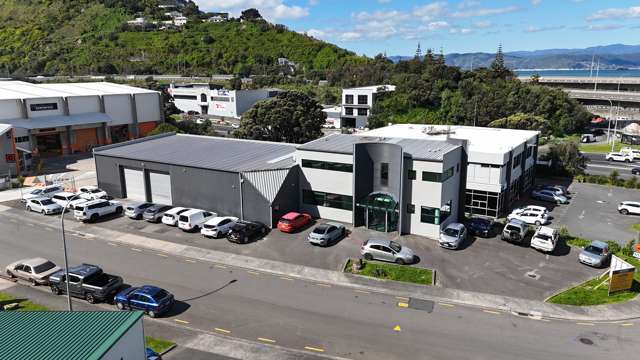
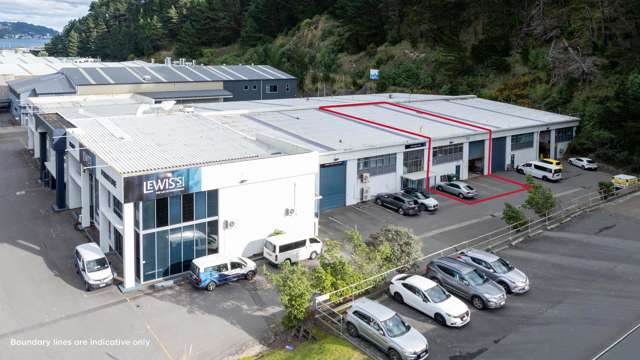
Cotality sales data shows industrial's share of total transaction value has increased from around 41 per cent in 2005 to just over 52 per cent in 2025, including a sustained run above 50 per cent since 2020.
Retail has followed a highly cyclical trajectory, reaching a peak of 32.5 per cent of market share in 2014 before easing through the late 2010s and early pandemic years.
Start your property search
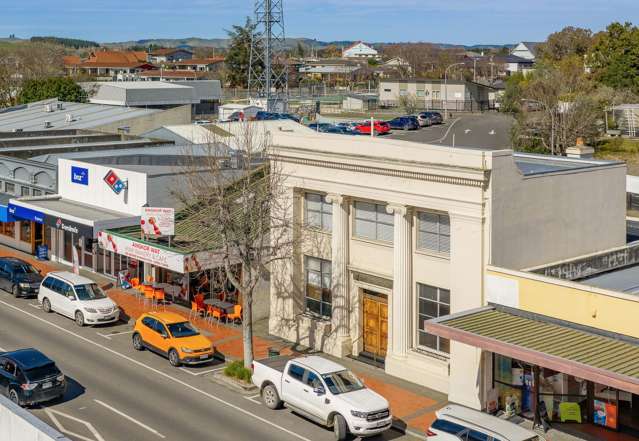
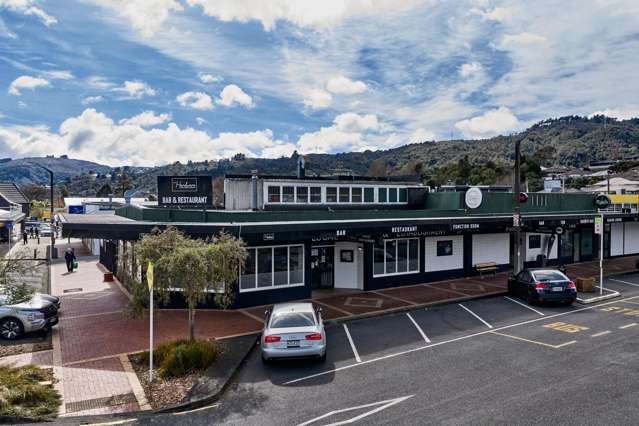
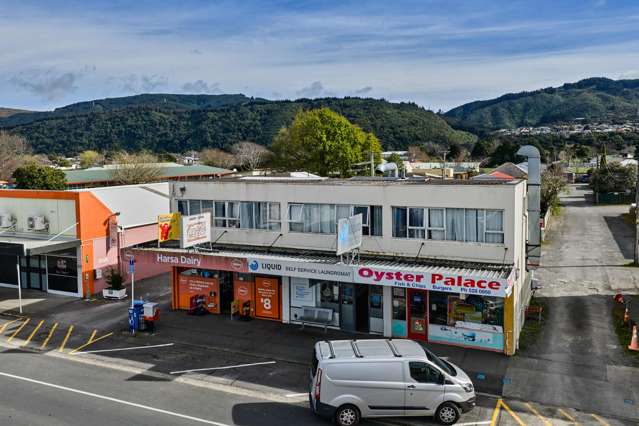
However, a notable recovery is underway, with retail’s share of total sales values lifting to 26.1 per cent in 2025, its highest level since 2016.
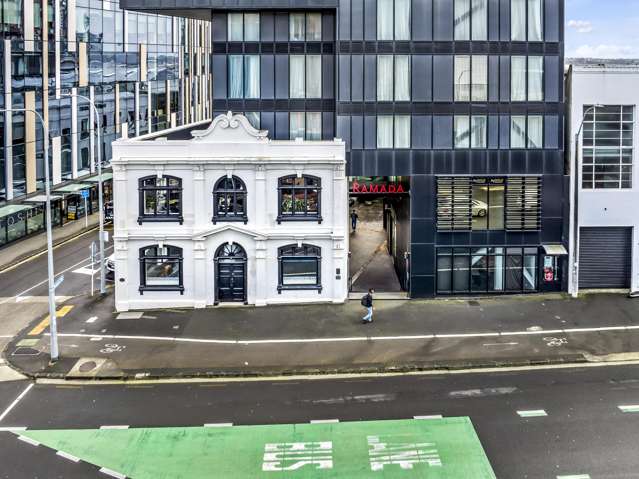
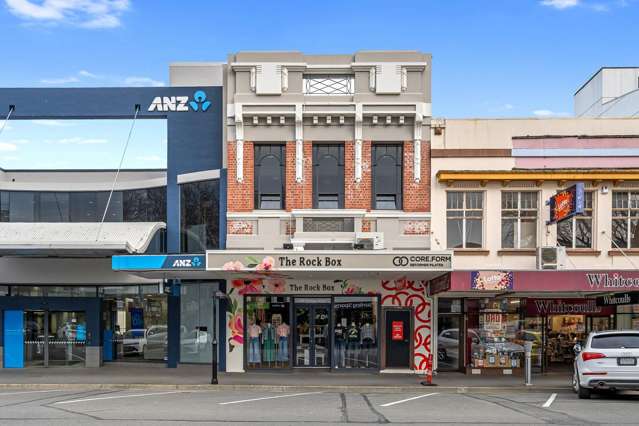
Office activity has also moved through cycles, peaking at a 30.8 per cent share of total sales value in 2018 before easing to 9.6 per cent more recently.
The analysis undertaken by the Colliers Research & Economics team as part of their July monthly report suggests this change in office sales reflects more cautious occupier demand, evolving workplace preferences, and a slower pipeline of transactions relative to other sectors.
Commercial mixed-use and vacant land has remained comparatively steady, generally accounting for around 12 to 18 per cent of sales value.
Hamish Fitchett, National Director of Research & Economics at Colliers, says the strong market share of sales reflects the appeal of industrial property for investors.
“Overall, this points to a New Zealand commercial property market where industrial has further strengthened its position, alongside a steady recovery in retail activity, and a more targeted, asset-specific environment for office investments,” Fitchett says.
“Transaction activity moves through cycles over time, typically following New Zealand's roughly eight-year economic cycle.
"Cotality data shows that national commercial property activity was elevated through the mid-2000s before easing following the Global Financial Crisis.
"Activity then rebounded through the mid-2010s as market conditions improved, reaching a more recent peak of approximately 5,600 transactions in 2022.
“Since then, activity has been more measured, with volumes easing from the 2022 peak.
"However, the 12-month data to March 2026 suggests conditions are beginning to stabilise, with transaction activity lifting modestly, up nearly 8 per cent year-on-year, alongside a 14 per cent increase in total sales value.
"The broader data points to improving market conditions post the 2022 correction driven by continued industrial strength and a firmer retail contribution.”
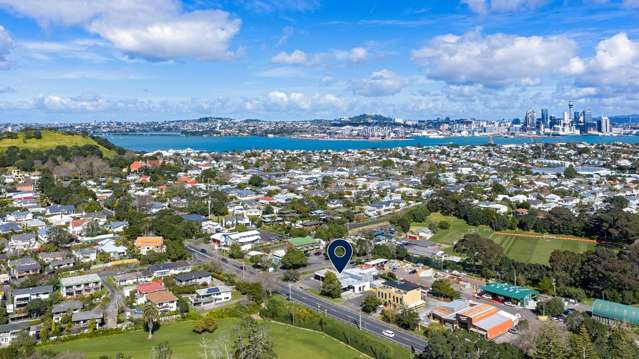
Auckland remains a key centre in the commercial property market, accounting for around 45 to 50 per cent of total sales value and largely shaping national trends.
Canterbury and the rest of the North Island tend to contribute a stable share of market activity, typically in the range of 15 to 18 per cent.
Maintaining a steady share of market activity means that these markets are growing in line with the wider market cycle and not operating independently.
Wellington and the rest of the South Island make up a smaller but steady share of total activity, generally accounting for around 5 to 10 per cent of total sales value.
Pritika Chand, Senior Research Analyst at Colliers, says while activity in the capital and various parts of the South Island can vary from year to year, they continue to play an important supporting role in overall market turnover.
“In summary, while Auckland continues to set the tone for national market performance, growth across centres such as Bay of Plenty and Canterbury suggests strengthening conditions are not limited to one market, indicating a broader uplift in activity across New Zealand's commercial property market.”
- Supplied by Colliers